

What is AI visibility?
AI visibility is the observed presence and treatment of a brand, product, person, or source inside generated answers. It includes whether the entity is mentioned, recommended, accurately described, and supported by a citation. It can also include the visits and commercial outcomes that follow—but those are downstream signals, not interchangeable parts of one score.
The practical answer to “How visible are we in AI search?” therefore needs four layers:
- Observed answer: Did the brand appear, and how was it framed?
- Source selection: Did the answer cite an owned or relevant third-party page?
- Site visit: Did a user follow a measurable link and engage?
- Business outcome: Did the journey contribute to a qualified lead, pipeline, or revenue?
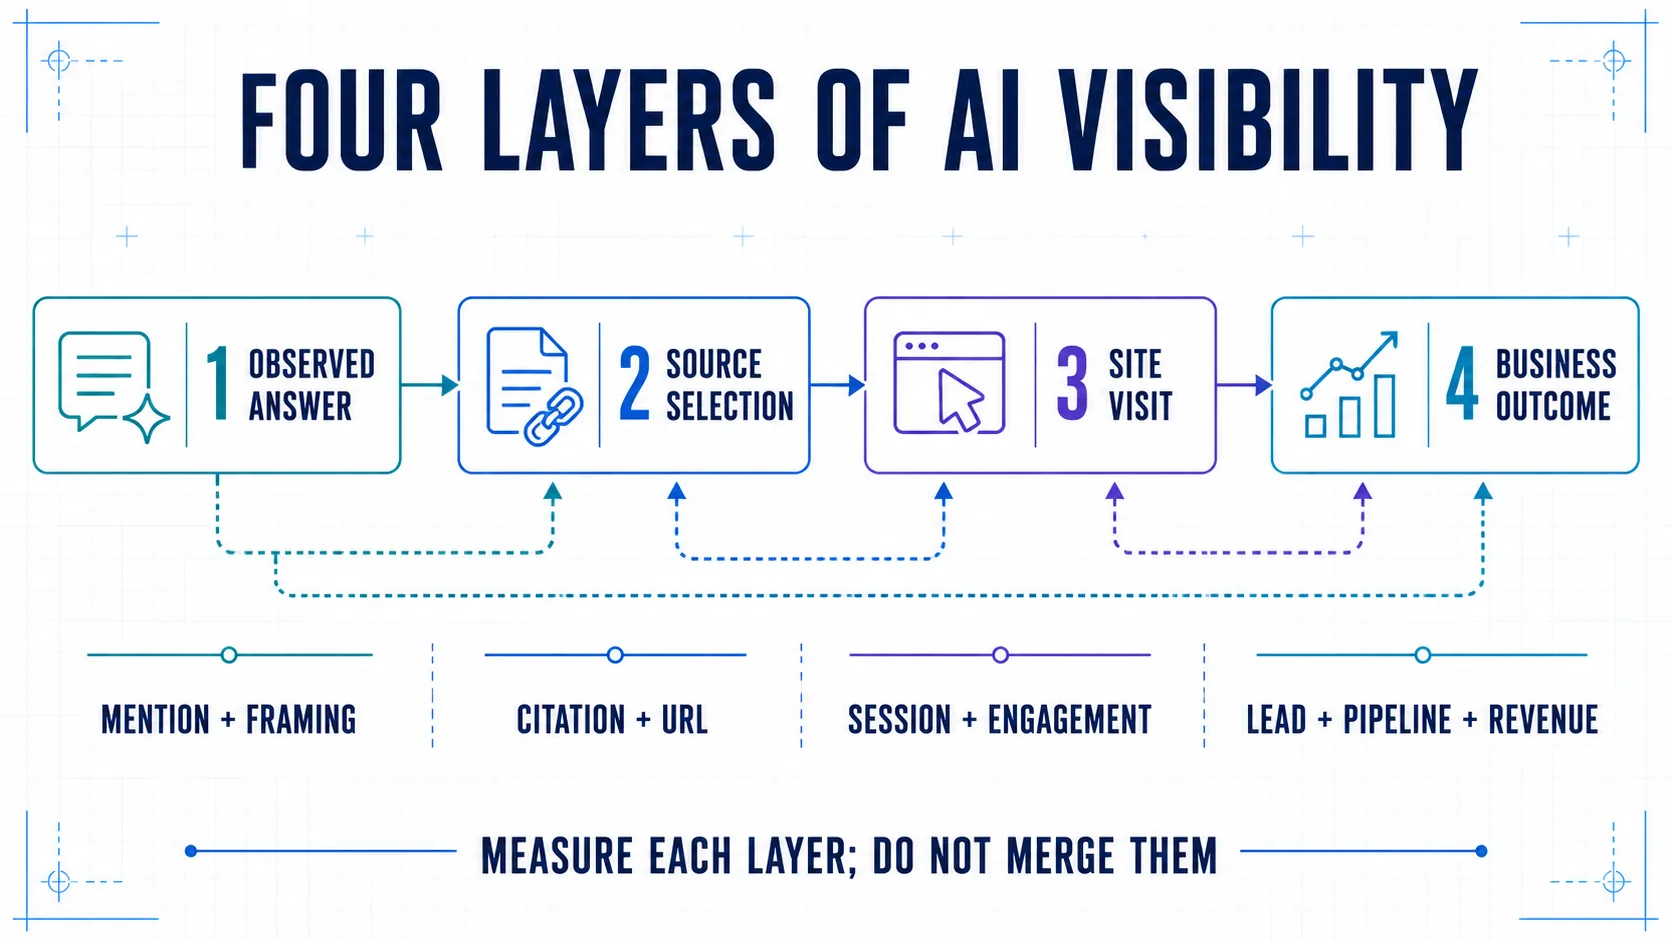
Measure all four where possible. Do not merge them into an opaque “AI score.” A mention is evidence of exposure; it is not proof of a visit. A visit is evidence of traffic; it is not automatically proof that the visit created revenue.
Why a traditional rank tracker is not enough
An ordinary search result commonly presents an ordered list of URLs for a query. A generated answer can synthesize several subjects, cite multiple passages, mention a company without linking to it, or return a different source set when the same prompt is repeated.
Visibility may vary with:
- platform, product surface, and search mode;
- model or system version;
- country, language, and location signals;
- logged-in state, personalization, and conversation history;
- exact prompt wording and follow-up questions;
- date, index freshness, and whether live search was invoked.
That makes “we rank first in ChatGPT” an incomplete statement. A defensible observation sounds more like this: “Our brand was explicitly recommended in 18 of 60 valid English responses collected across three repeated runs of 20 fixed commercial prompts, in a neutral session, for the UK market, during the week of 31 August 2026.”
The second statement can be audited. It also exposes the sample and conditions instead of pretending that a permanent position exists.
Start with a measurement contract
A measurement contract is the written specification that makes two reporting periods comparable. Create it before choosing a monitoring vendor or building a dashboard.
At minimum, the contract should define:
| Decision | Definition to freeze |
|---|---|
| Measurement objective | The business decision this report will inform |
| Entity dictionary | Official brand name, products, abbreviations, aliases, domains, and exclusions |
| Competitor set | Named brands included in share-of-voice calculations |
| Prompt cohort | Exact prompts, family, topic, market, language, and buyer stage |
| Run conditions | Platform, surface or mode, session state, location, and repetitions |
| Valid response | Rules for refusals, errors, empty answers, and unavailable search |
| Classifications | Mention, recommendation, citation, accuracy, sentiment, and relevance rubrics |
| Metric formulas | Numerator, denominator, unit of analysis, segmentation, and weighting |
| Attribution model | How referrals, assists, conversions, pipeline, and revenue receive credit |
| Change control | How new prompts, competitors, aliases, and platform changes create a new baseline |
This is less glamorous than a dashboard, but it is the part that makes the chart meaningful. If the prompt list, competitor set, or validity rule changes silently, the trend line no longer compares like with like.
Working artifact: Download the AI Visibility Measurement Contract (Markdown). It includes the cohort specification, exact formula fields, observation schema, analytics rules, experiment log, and 30/60/90-day review.
Build a prompt cohort that represents real demand
1. Start with decisions, not keywords
Choose topics tied to a buyer decision or a reputation risk. For a B2B digital consultancy, the set might include generative engine optimization services, AI visibility audits, headless commerce architecture, or technical SEO migrations.
For each topic, record the decision the answer could influence. A definition prompt and a supplier-shortlist prompt should not carry the same commercial weight simply because both contain the same phrase.
2. Create prompt families
Use several families so the sample covers the buyer journey:
| Family | Example | What it tests |
|---|---|---|
| Definition | “What is generative engine optimization?” | Category association |
| Problem | “How can a B2B brand measure visibility in AI answers?” | Problem relevance |
| Comparison | “AI visibility software vs a GEO agency” | Alternative framing |
| Recommendation | “Recommend GEO agencies for a DACH manufacturer” | Commercial inclusion |
| Implementation | “How should OAI-SearchBot access be configured?” | Technical authority |
| Branded accuracy | “What does AppWebSeo specialize in?” | Entity accuracy |
Include negative controls: prompts where the brand should not appear. A system that rewards the brand for appearing everywhere can encourage irrelevant coverage and makes false positives look like success.
3. Freeze the observation conditions
For every run, record:
- exact prompt text and a permanent prompt ID;
- platform, product surface, and visible model label where available;
- country, language, and relevant location setting;
- neutral, logged-in, or personalized session state;
- new conversation or follow-up context;
- search-enabled state where it is visible;
- date, time, run number, and observer;
- the full answer and every displayed source URL.
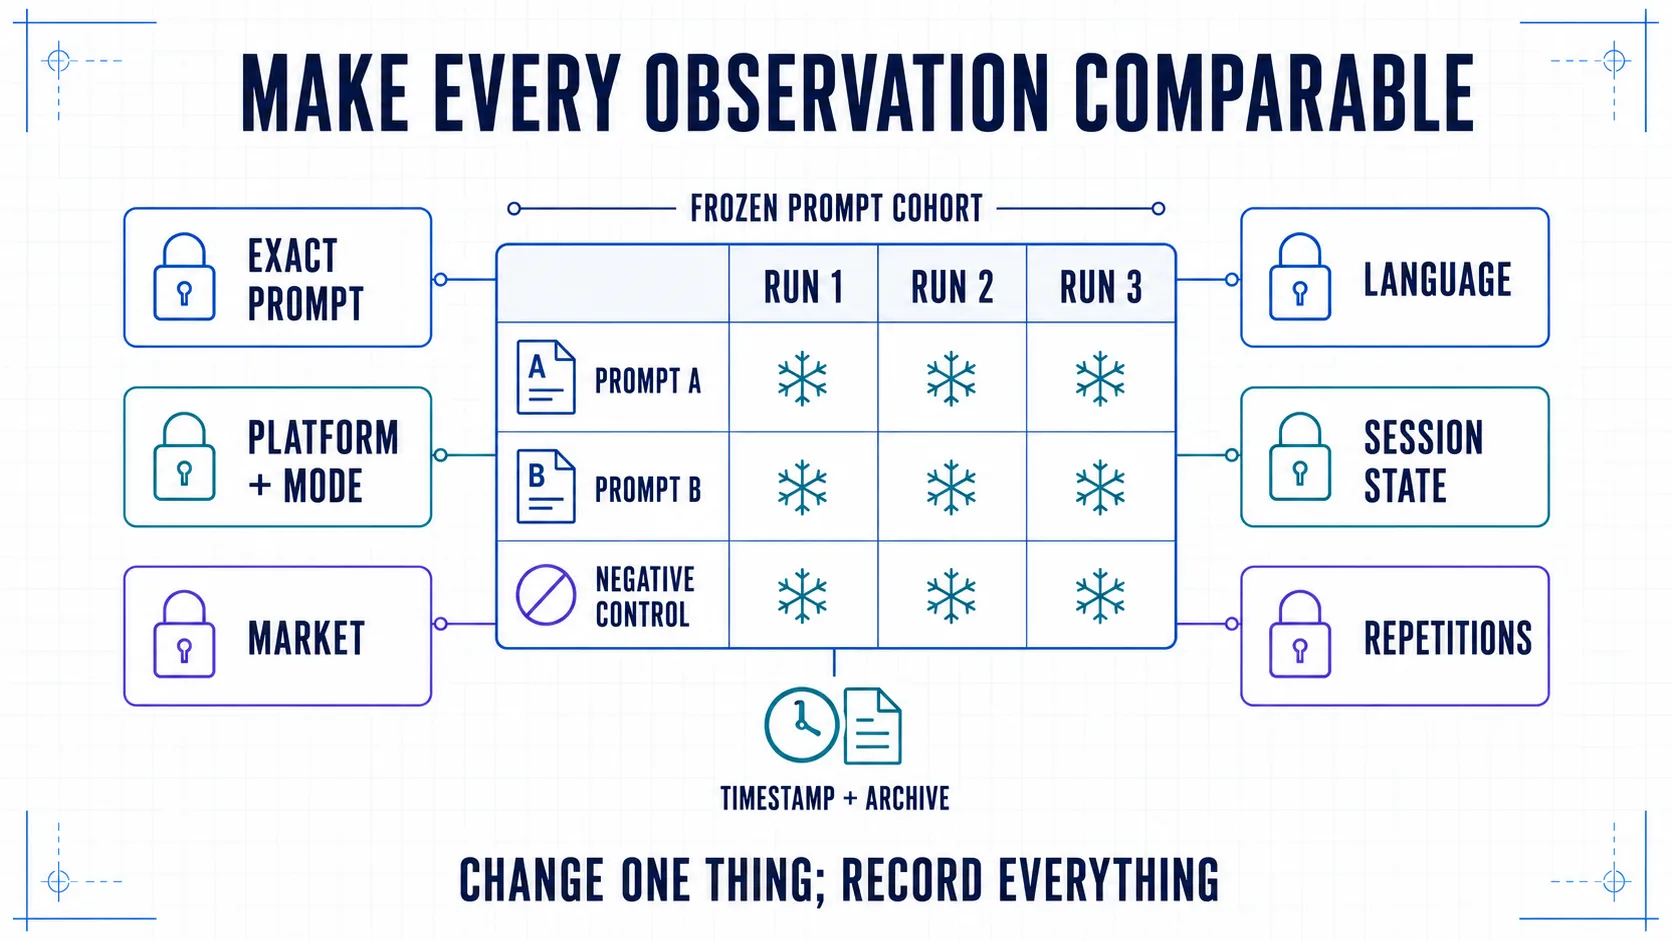
Do not mix a neutral first-turn query with a personalized fifth follow-up and report the difference as a visibility trend. Either hold conditions constant or segment them.
4. Define a valid response
A denominator needs an eligibility rule. Decide in advance how to treat:
- technical errors and timeouts;
- refusals and “I cannot browse” responses;
- empty or truncated outputs;
- duplicate captures;
- answers returned without the requested search mode;
- responses in the wrong language or market;
- prompts whose subject has become obsolete.
Typically, infrastructure errors are excluded from valid responses and reported separately as collection failures. A valid answer that simply omits the brand stays in the denominator. Excluding ordinary non-mentions would inflate the metric.
5. Repeat and version the cohort
Repeated runs reveal whether an apparent change persists. Keep a stable core cohort for trend reporting. Add exploratory prompts in a separate cohort until they have a baseline.
Version the contract when a material condition changes. A new competitor, a revised prompt, or a platform mode change may be useful, but the new result should not be spliced into the old time series without a break marker.
Preserve raw observations before calculating scores
Store the complete response and sources as immutable evidence. Derived labels can be corrected later; the original observation should remain recoverable.
A minimum response record contains:
observation_id | collected_at | platform | surface_or_mode
country | language | session_state | run_number
prompt_id | prompt_version | exact_prompt | valid_response
brand_mentioned | prominence | recommendation
owned_url_cited | all_source_urls | competitors_mentioned
accuracy_label | sentiment_label | reviewer | notes
Normalize URLs separately so tracking parameters, fragments, trailing slashes, and redirected forms do not create false “new source” counts. Keep both the displayed URL and the normalized canonical URL.
For consequential classification, write a short rubric and save representative examples. A second reviewer can independently label a sample. Agreement matters more than pretending that a subjective category is perfectly precise.
The metrics that matter—and their denominators
These metrics answer different questions:
| Metric | Numerator | Denominator | What it establishes | What it does not establish |
|---|---|---|---|---|
| Mention rate | Valid responses mentioning the entity | Valid responses | Observed exposure | Endorsement, citation, or traffic |
| Prompt coverage | Prompts with at least one mention | Eligible prompts | Breadth across the cohort | Stability across repeated runs |
| Recommendation rate | Valid responses explicitly recommending the entity | Valid responses | Recommendation frequency | Purchase intent or conversion |
| Owned citation response rate | Valid responses citing at least one owned URL | Valid responses | Owned-source selection | Number or quality of clicks |
| Citation share | Owned citations | All observed citations | Share of selected sources | Visibility in answers with no citation |
| Response-based SOV | Your brand-response flags | Flags for all tracked brands | Competitive presence in a closed set | Total market awareness |
| Accuracy rate | Accurate evaluable claims about the entity | All evaluable claims about the entity | Factual reliability in the sample | Completeness when no claim appears |
| AI referral CVR | Qualified conversions from classified AI referrals | Classified AI referral sessions | On-site commercial efficiency | Influence from unclicked answers |
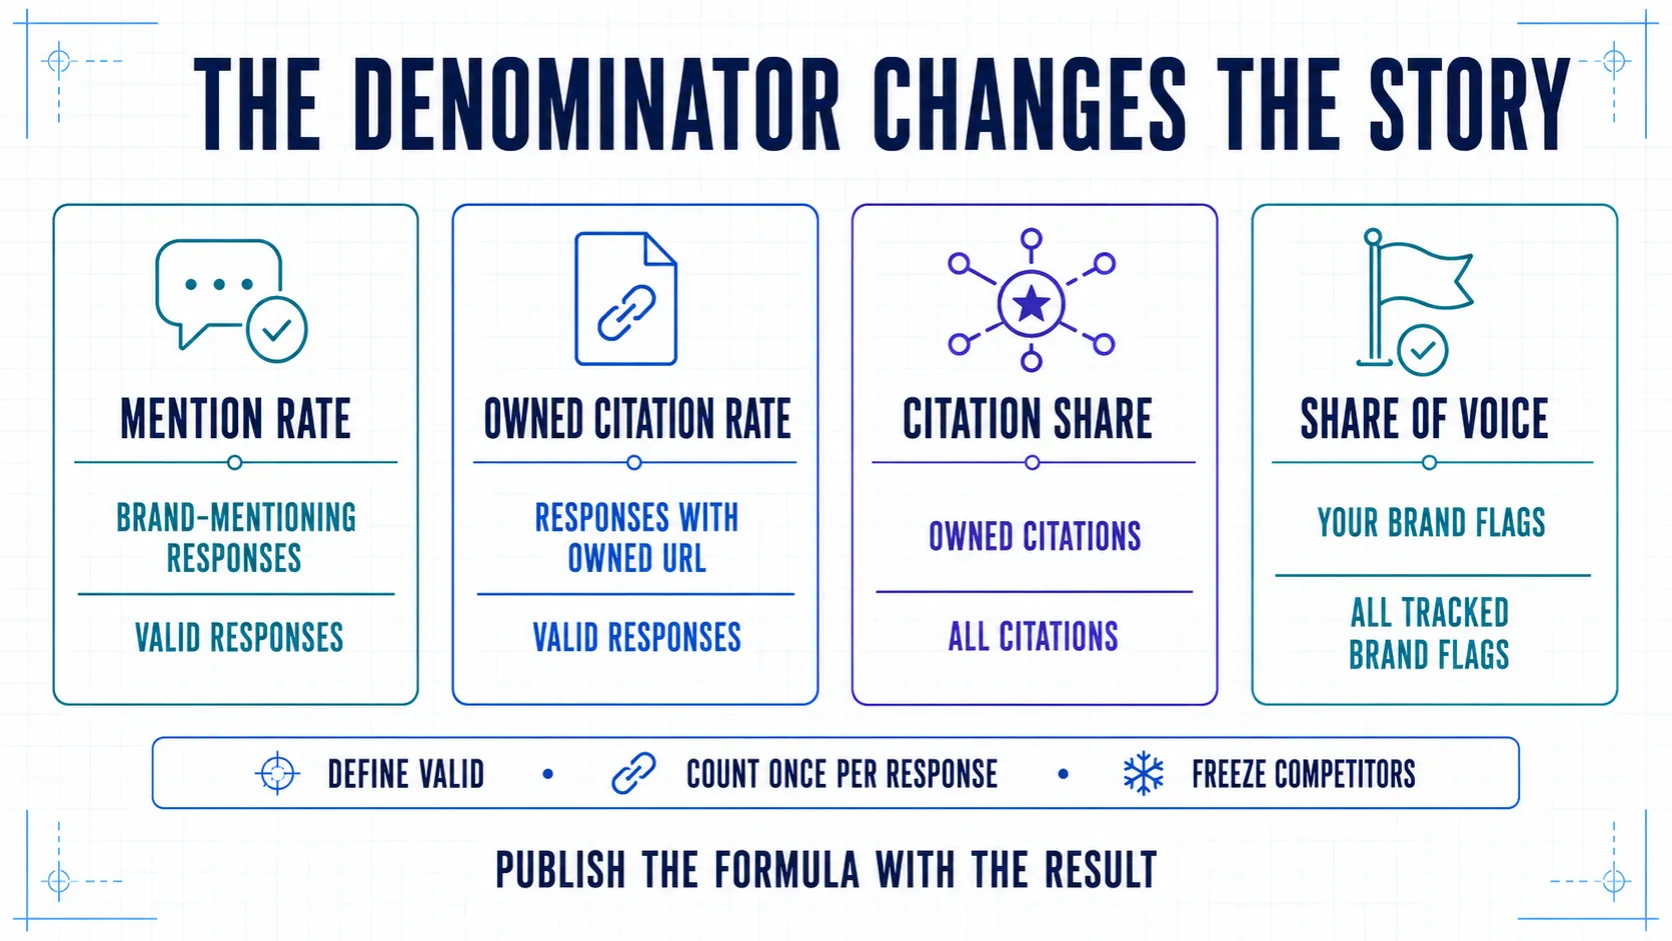
Mention rate
Count a response once when it contains a valid entity match, even if the name appears five times.
Mention rate = brand-mentioning valid responses / all valid responses × 100Report mention rate by platform, topic, prompt family, market, and buyer stage. A global average can hide visibility for low-intent definitions and absence from high-intent recommendations.
Prompt coverage
Coverage prevents a small set of frequently repeated prompts from dominating the story.
Prompt coverage = eligible prompts with at least one mention / all eligible prompts × 100Report it beside the repetition-based mention rate. Coverage answers “where do we ever appear?” while mention rate answers “how often did we appear across observed responses?”
Recommendation rate and prominence
An entity can be mentioned as a source, comparison, warning, or explicit recommendation. Use a small, documented rubric:
| Label | Definition |
|---|---|
| Recommended | Explicitly suggested for the stated use case |
| Included | Present in a relevant shortlist without strong endorsement |
| Referenced | Used as an example, fact source, or incidental comparison |
| Negative | Accompanied by a material warning or criticism |
| Irrelevant | Entity match does not answer the intended question |
Do not turn this into a 97.3-point “prominence score” unless the weighting has been validated. Clear categories are easier to audit.
Owned citation response rate
This is a response-level measure:
Owned citation response rate =
valid responses with at least one owned URL / all valid responses × 100
Keep it separate from citation share. A response with three links to your domain still counts once here.
Citation share and source coverage
Citation share is a source-level measure:
Citation share = normalized owned citations / all normalized citations × 100State whether repeated appearances of the same URL in one answer count once or multiple times. “One normalized URL per response” is often the cleaner rule.
Source coverage adds a useful diagnostic:
- distinct owned pages cited;
- citation frequency per page;
- prompt families served by each page;
- stale, redirected, or incorrect URLs;
- third-party pages used to substantiate the brand.
If all owned citations depend on one article, visibility may be broad in count but fragile in source diversity.
Competitive share of voice
Define the competitor set before collection. A response contributes one flag for each tracked brand it mentions, so a comparison answer can contribute several flags.
Response-based SOV =
your brand-response flags / flags for all tracked brands × 100
State the brands, aliases, and exclusions in every report. Adding a major competitor changes the denominator and creates a new baseline.
The share-of-voice paradox: your mention rate can rise while your SOV falls. If your brand moves from 20 to 30 mentions per 100 responses, mention rate improved. But if competitor flags rise from 20 to 70, your SOV falls from 50% to 30%. Neither metric is wrong; they answer different questions.
Factual accuracy
Create an entity fact register covering the official company name, locations, services, product capabilities, leadership, certifications, availability, and pricing model where public.
For each evaluable claim in an observed answer, label it accurate, outdated, unsupported, or contradictory. The denominator is claims that can be checked—not all responses.
Preserve the answer excerpt, authoritative reference, review date, and remediation owner for every error. Accuracy without an evidence trail is only an opinion.
Sentiment
Use a simple rubric such as positive, neutral, mixed, or negative. Segment by relevance and prominence: a neutral technical citation may be more valuable than enthusiastic but irrelevant praise.
Sentiment describes framing. It is not a substitute for conversion or revenue.
Report sample size and uncertainty
Generated answers are variable observations. A single run is a screenshot, not a stable estimate.
Every reported rate should include:
- the number of eligible prompts;
- repetitions per prompt;
- valid response count;
- excluded-response count and reasons;
- collection dates and conditions;
- observed percentage;
- change from the frozen baseline;
- an uncertainty interval or practical noise band where the sample supports it.
The 2026 preprint Quantifying Uncertainty in AI Visibility models AI-visibility metrics as estimates from a distribution of possible responses and shows why repeated sampling and uncertainty reporting matter. It is useful primary research, not a universal benchmark: the authors also state limitations in platform and topic coverage and leave minimum sample-size guidance for future work.
For an operating dashboard, start with repeated baseline runs under the same conditions. Plot the range or a response-level bootstrap interval if the team has statistical support. If not, show the raw numerator, denominator, and run-to-run spread. That is more honest than adding decimal places.
There is no credible universal “good AI visibility” percentage. Expected coverage differs by category, intent, brand maturity, geography, platform, and the closed competitor set. Use your frozen baseline, business priorities, and matched experiments as the benchmark.
Use platform data for what it can actually prove
Google Search Console
Google documents a Generative AI performance report for impressions from AI Overviews and AI Mode. Its dimensions include page, country, device, and date. Google says the worldwide rollout began on 31 August 2026, so absence should be interpreted carefully while access and data accumulate.
Google also documents important counting details:
- two results from the same property inside one generative feature count once in the property-level chart;
- page-level data is assigned to the canonical final URL;
- visible rows are subject to Search Console reporting limits;
- an AI Mode follow-up is treated as a new query for reporting.
Use this report for observed visibility of your owned property in Google's generative surfaces. Do not relabel it as a cross-platform mention metric or assume that an unavailable report proves zero visibility.
Keep ordinary Search data beside it: non-brand queries, clicks, landing pages, country, device, conversions, indexed coverage, and technical errors. Google's impression, position, and click documentation defines how those standard metrics apply to AI features.
ChatGPT referrals
OpenAI says in its Publishers and Developers FAQ that ChatGPT search referral URLs include the parameter utm_source=chatgpt.com. Preserve query parameters through redirects and landing-page scripts, then test how the source is classified in analytics.
Track:
- sessions and users;
- landing pages and content groups;
- engaged sessions or equivalent quality events;
- demo, signup, lead, or purchase conversions;
- qualified pipeline and revenue where CRM evidence exists.
Referral data captures people who clicked. It does not measure users who saw a mention but never visited.
OpenAI's crawler documentation distinguishes OAI-SearchBot, GPTBot, and ChatGPT-User. Those controls can help diagnose access; they do not expose total answer impressions.
Perplexity and other AI sources
Track verified referrers in analytics and inspect the current platform documentation before hard-coding classification rules. Perplexity documents its crawler identities, but crawler access is not a visibility metric.
Manual panels or third-party monitoring remain necessary for unclicked mentions and citations outside provider-owned reporting. Treat vendor results as observations collected under that vendor's protocol. Google explicitly notes in its third-party SEO guidance that outside tools do not have access to its internal ranking systems.
Connect AI visibility to revenue without overclaiming
Use an evidence ladder:
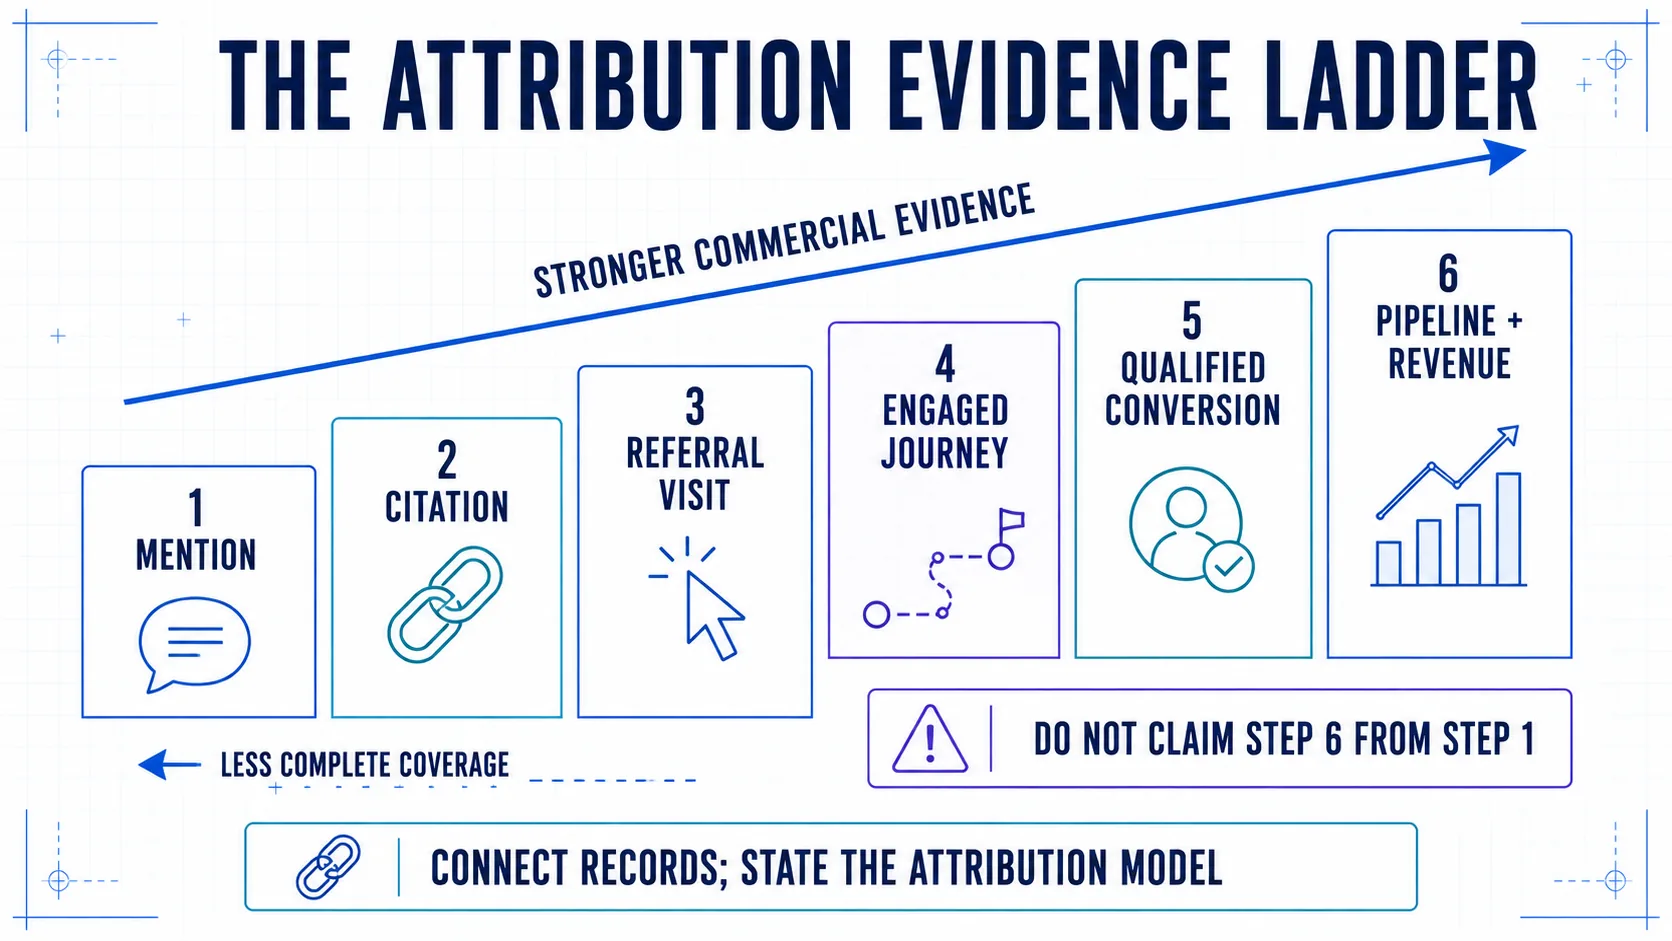
| Level | Evidence | Defensible statement |
|---|---|---|
| 1 | Brand mentioned | Exposure was observed in the measured sample |
| 2 | Owned or trusted source cited | A source was selected in the measured sample |
| 3 | Classified referral session | A user reached the site from a detectable AI source |
| 4 | Engaged or assisted journey | The visit contributed to evaluation under the stated model |
| 5 | Qualified conversion | A commercially relevant action was recorded |
| 6 | Pipeline or revenue | A CRM or commerce outcome received defined attribution |
Do not claim step six from step one.
Configure analytics explicitly
Create and test an AI-referral rule set using full referrers and known campaign parameters. Preserve the raw source/medium fields even if the reporting layer groups them into a custom channel.
Google's GA4 documentation explains default channel groups, attribution models, and cross-domain measurement. Use those definitions to document—not hide—how credit is assigned.
Then connect:
AI source → landing page → engaged journey → conversion
→ qualified lead or order → opportunity → revenue
Exclude internal referrals, payment-provider returns, testing traffic, and bot activity. Test cross-domain journeys where forms, checkout, or booking systems live on another domain.
Add CRM and self-reported evidence
For lead-generation businesses, pass landing-page and original-source data into the CRM. Keep first-touch, last-touch, and assisting AI-source fields separate if the sales cycle requires them.
Add a free-text “How did you hear about us?” field or a carefully designed choice list. A prospect may say “ChatGPT” even when no detectable referral exists because they later navigated directly. Self-reported attribution is imperfect, but it helps reveal otherwise dark influence when kept separate from clickstream attribution.
Report pipeline using a fixed definition of qualified stage, currency, and attribution window. Revenue is not comparable if one month uses created opportunities and the next uses closed-won revenue.
Build a dashboard that leads to decisions
A useful dashboard begins with cohort health and moves downstream:
| Section | Metric | Required segment | Typical action |
|---|---|---|---|
| Collection | Valid responses, failures, repetitions | Platform, mode, market | Fix sampling or mark a break |
| Exposure | Mention rate, coverage, prominence | Topic, family, buyer stage | Improve category relevance |
| Evidence | Owned citation rate, citation share, source coverage | URL, source type | Strengthen or consolidate source assets |
| Competition | Response-based SOV | Fixed competitor set | Investigate gaps by intent |
| Trust | Accuracy and sentiment | Fact class, reviewer | Correct entity facts and corroboration |
| Generative impressions and clicks | Page, country, device, date | Diagnose owned-page discovery | |
| Traffic | AI referral sessions and engagement | Source, landing page | Improve the post-click journey |
| Business | Qualified leads, pipeline, revenue | Service, market, attribution model | Reallocate investment |
Show both counts and rates. Put the measurement-contract version, sample dates, and known limitations on the same page as the chart—not in an invisible appendix.
Read combinations, not isolated movements
- Mentions rise, citations do not: the entity may be known, but owned pages are not being selected as evidence.
- Citations rise, referrals do not: source selection improved; inspect link prominence, intent, and the value of clicking.
- Referrals rise, conversions do not: the visibility system may be working while the landing experience or audience fit is weak.
- Accuracy falls while mentions rise: reach expanded, but the entity truth layer needs urgent correction.
- SOV falls while mention rate rises: the category may be expanding faster for competitors.
These combinations turn reporting into an action map.
Measure releases as matched experiments
For a content, technical, or entity-data change:
- State a falsifiable hypothesis.
- Freeze the cohort, rubric, and conditions.
- Capture repeated baseline runs.
- Record the changed URLs, release date, and implementation details.
- Verify crawling, rendering, indexing, and analytics instrumentation.
- Allow a predefined observation window.
- Repeat the same cohort and segment.
- Compare visibility and business layers separately.
- Record competing explanations and the decision.
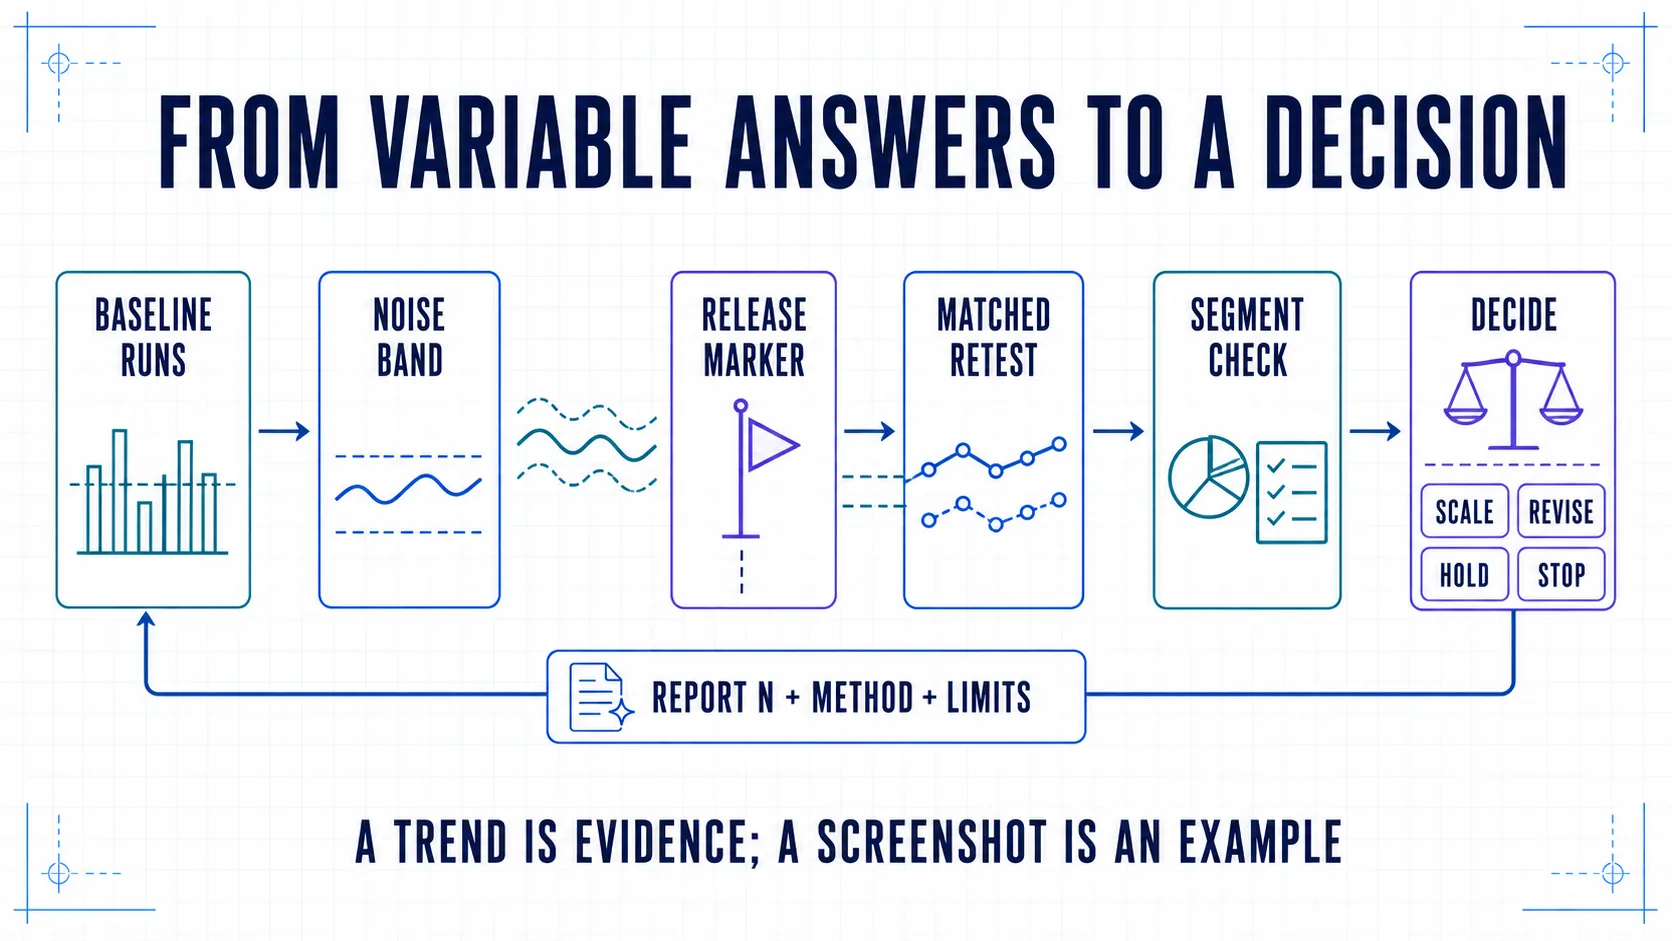
Models, indices, competitors, interfaces, and answer formats can change during the experiment. A release marker shows timing; it does not prove causation. Stronger confidence comes from repeated matched observations, segment consistency, supporting crawl and citation evidence, and plausible downstream movement.
How often should you measure?
- Crawler, technical, and referral monitoring: continuously where logs and analytics permit.
- Stable prompt cohort: monthly for a strategic view; weekly during a time-bounded experiment if the sample and tooling support it.
- Executive reporting: monthly or quarterly, aligned with the sales cycle.
- Accuracy incidents: immediately, with follow-up until the error no longer appears in repeated observations.
- Release review: baseline plus predefined 30-, 60-, and 90-day checkpoints where discovery cycles justify them.
Avoid rewriting the cohort every week. Keep exploratory discovery separate from the stable trend cohort.
How to evaluate an AI-visibility tool
Before buying software, ask the vendor to show:
- the exact platforms, modes, markets, and languages covered;
- whether full responses and cited URLs are exportable;
- the valid-response and retry rules;
- repetitions, collection timing, and session controls;
- entity matching, alias, and false-positive handling;
- formulas and denominators for every proprietary score;
- competitor-set change history;
- URL normalization and redirect handling;
- human-review and classification workflows;
- raw data retention, deletion, privacy, and API access;
- how platform changes are annotated;
- whether analytics and CRM integrations preserve first-party evidence.
A polished score is not a methodology. If the raw response, formula, and cohort cannot be inspected, the number will be difficult to reproduce or defend.
Common measurement mistakes
- Treating a proprietary visibility score as an official platform metric.
- Mixing mentions, citations, impressions, clicks, and conversions into one number.
- Presenting one answer screenshot as a persistent rank.
- Omitting prompt text, conditions, sample size, or collection dates.
- Excluding ordinary non-mentions from the denominator.
- Changing prompts or competitors without creating a new baseline.
- Counting crawler access, schema validation, or an llms.txt file as a visibility outcome.
- Reporting sentiment as commercial value.
- Using last-click revenue to dismiss earlier influence—or mention growth to invent revenue.
- Comparing platforms as if their products, source displays, and observation methods were identical.
- Promising a fixed uplift before baseline measurement.
Bottom line
AI visibility is not one rank and should not be one score. Define a fixed prompt cohort, preserve every raw answer, publish the denominator behind each metric, repeat observations, and report uncertainty. Then connect citations to verified referral journeys and commercial outcomes using explicit analytics and CRM rules.
The result is more than a visibility chart. It is a measurement system that can show what changed, what did not, how confident the team should be, and whether the next decision is to scale, revise, hold, or stop.
Use the GEO audit checklist to collect technical and editorial evidence, the AI citation publishing guide to improve source assets, and the complete GEO guide to design the next controlled intervention.
Primary sources
- Google Search Console: Generative AI performance report
- Google Search Console: Impressions, position, and clicks
- Google: Optimizing for generative AI features
- Google: Guidance on third-party SEO tools and advice
- Google Analytics: Default channel groups
- Google Analytics: Attribution models
- OpenAI: Publishers and Developers FAQ
- OpenAI: Overview of OpenAI crawlers
- Perplexity: Crawler documentation
- Quantifying Uncertainty in AI Visibility: A Statistical Framework for Generative Search Measurement